
Statewide Nutrient Data
Monitoring and Analysis of Illinois’ Major Rivers
Eight major rivers drain parts of Illinois. Together, the drainage areas of these watersheds represent about 75% of Illinois’ land area. Monitoring nutrients in these rivers provides a basis for estimating statewide nutrient export.
WQ.01: Illinois Map Showing Major River Watershed Boundaries and Monitoring Locations
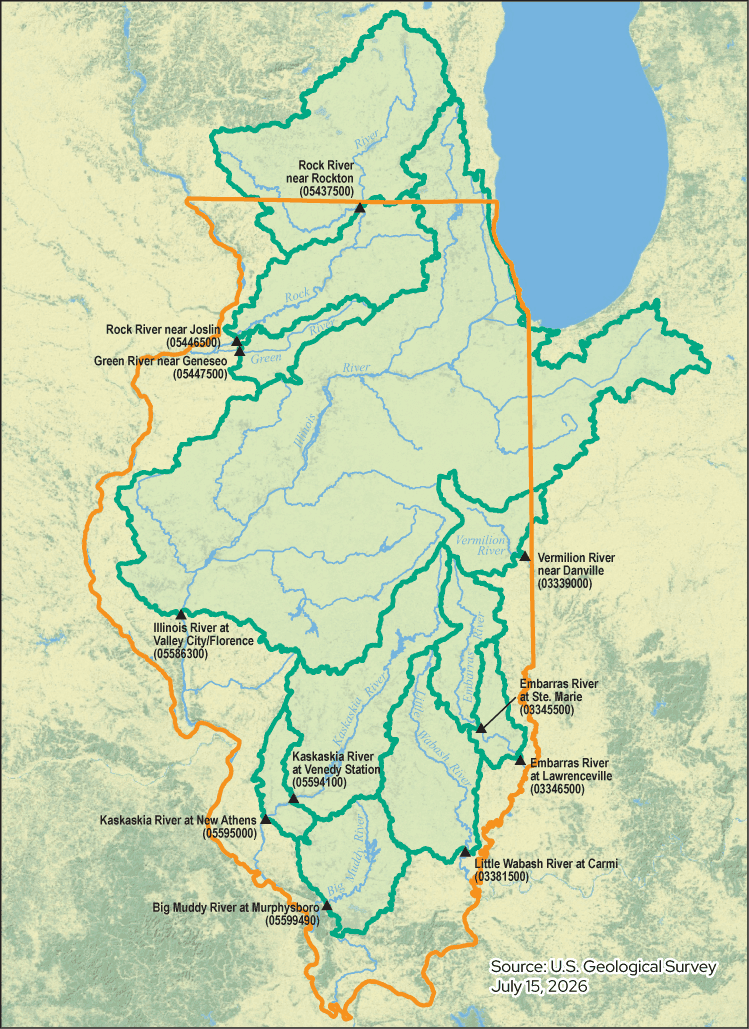
Illinois’ eight major river watersheds together drain about 75% of the state, and the monitoring locations shown on this map capture nutrient flows from those drainage areas.
To calculate statewide nutrient loads, scientists combine the loads, or pounds per year of nutrients, measured at monitoring locations near each river’s outlet. Loads are adjusted for ungaged regions and for regions extending outside of Illinois.
Before water year 2020, nutrient loads were estimated using data from Illinois EPA Ambient Water Quality Network sampling sites and from USGS streamflow gages. Total phosphorus was estimated using a statistical method called Weighted Regression on Time, Discharge, and Season, or WRTDS, while nitrate-nitrogen was estimated using linear interpolation.
WQ.02: Monitoring Stations Used To Estimate The Statewide Nitrate-Nitrogen And Total Phosphorus Loads Prior To 2020
| River System | Gage Location | Illinois EPA ID | USGS ID | Drainage Area (square miles) | Drainage Area in Illinois (%) | % of Illinois Represented |
|---|---|---|---|---|---|---|
| Big Muddy | Murphysboro | N-12 | 05599490 | 2,159 | 100 | 3.8 |
| Embarras | Ste. Marie | BE-07 | 03345500 | 1,516 | 100 | 2.7 |
| Green | Geneseo | PB-04 | 05447500 | 1,003 | 100 | 1.8 |
| Illinois | Valley City | D-32 | 05586100 | 26,743 | 84 | 39.9 |
| Kaskaskia | Venedy Station | O-20 | 05594100 | 4,393 | 100 | 7.8 |
| Little Wabash | Carmi | C-23 | 03381500 | 3,102 | 100 | 5.5 |
| Rock | Joslin | P-04 | 05446500 | 9,549 | 43 | 7.3 |
| Rock | Rockton | P-15 | 05437500 | 6,363 | 13 | 1.4 |
| Vermilion | Danville | BP-01 | 03339000 | 1,290 | 93 | 2.1 |
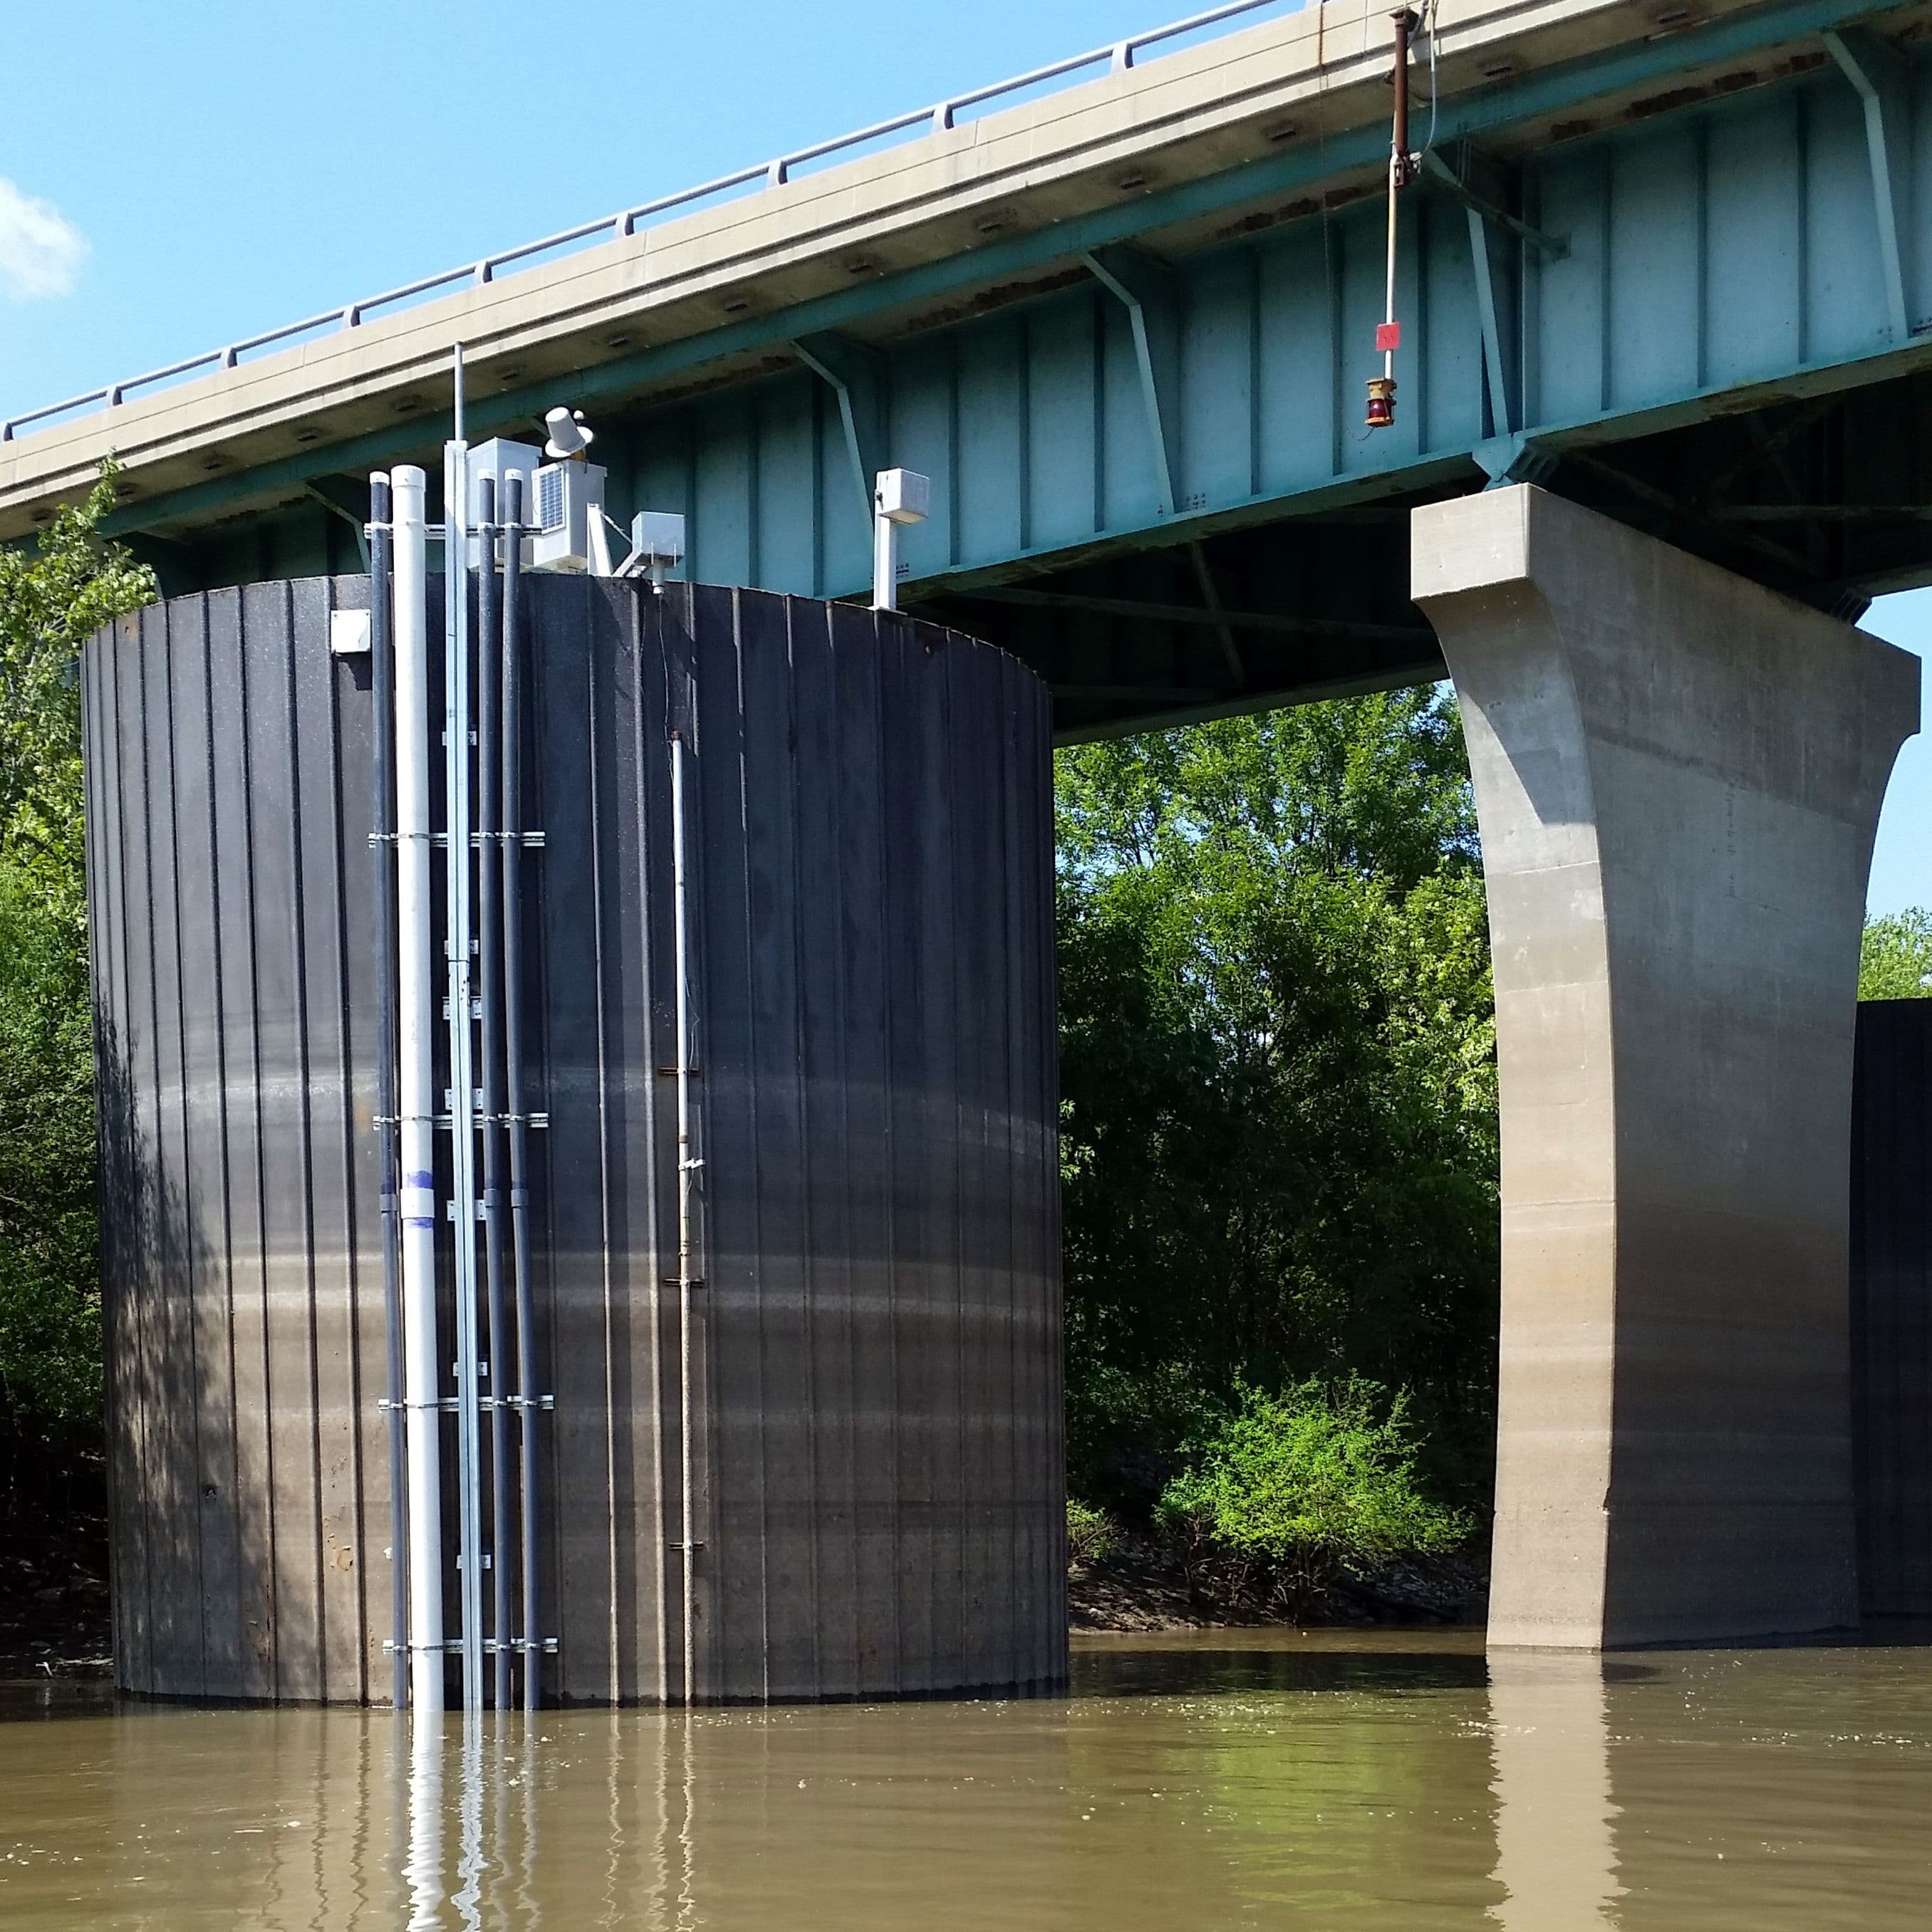
Starting in 2015, eight USGS high-frequency nutrient monitoring stations, also called super gages, were installed on Illinois’ major rivers. In 2018, the Metropolitan Water Reclamation District of Greater Chicago funded a USGS high-frequency nutrient monitoring sensor on the Des Plaines River, expanding monitoring to include areas draining portions of the Chicago metropolitan region. Beginning in 2020, statewide NLRS load calculations shifted to rely on these high-frequency monitoring sites located at or near the original Illinois EPA sampling locations.
More detail on these calculation methods is available in Hirsch, et al. (2015), Hodson, et al. (2022), and the Illinois NLRS Biennial Reports from 2015, 2021, and 2023.
WQ.03: Major Rivers High-Frequency Nutrient Monitoring Stations Used To Estimate Statewide Nutrient Loads After 2020
| River System | Gage Location | USGS ID | Station Drainage Area in Illinois only (square miles) | Scaling Factor to pre-2020 watershed area |
|---|---|---|---|---|
| Big Muddy | Murphysboro | 05599490 | 2,168 | 1 |
| Embarras | Lawrenceville | 03346500 | 2,348 | 0.65 |
| Green | Geneseo | 05447500 | 1,000 | 1 |
| Illinois | Florence | 05586300 | 22,631 | 1 |
| Kaskaskia | New Athens | 05595000 | 5,189 | 0.85 |
| Little Wabash | Carmi | 03381500 | 3,102 | 1 |
| Rock | Joslin | 05446500 | 3,973 | 1 |
| Vermilion | Danville | 03339000 | 1,199 | 1 |
View the Monitoring Stations:
- Big Muddy, Murphysboro, 05599490
- Embarras, Lawrenceville, 03346500
- Green, Geneseo, 05447500
- Illinois, Valley City, 05586100
- Kaskaskia, New Athens, 05594100
- Little Wabash, Carmi, 03381500
- Rock, Joslin, 05446500
- Vermilion, Danville, 03339000
Sensors at USGS high-frequency monitoring stations record several key water-quality metrics:
- Streamflow
- Nitrate-nitrogen
- Orthophosphate (in the Illinois and Kaskaskia rivers)
- Turbidity (or water clarity, and sometimes used as a proxy for total phosphorus)
- Temperature
- Specific conductance
- Dissolved oxygen
- pH
Statewide Nutrient Loads and Water Yield
Illinois’ nitrate-nitrogen and total phosphorus loads are closely linked to water yield, or streamflow. Water yield is the precipitation in inches per year that flows down the rivers. Periods of high rainfall and runoff increase water yield and tend to increase nutrient loss. Likewise, periods of drought, which decrease water yield, tend to decrease nutrient loss.
Most recent water year monitoring information indicates that:
2020-24 water yield five-year average was 13.2 inches per year, 2% above the 1980–96 baseline.
2020-24 nitrate-nitrogen five-year average was 316 million pounds per year, 17% below the 1980–96 baseline.
2020-24 total phosphorus five-year average was 38 million pounds per year, 12% above the 1980–96 baseline.
WQ.04: Statewide Nitrate-Nitrogen Loads and Water Yields 1980 to 2024
WQ.05: Statewide Total Phosphorus Loads and Water Yields 1980 to 2024
WQ.06: Statewide Estimated Water Yields, Nitrate-Nitrogen Loads, And Total Phosphorus Loads For The 1980–96 Baseline Period And Recent Five-Year Periods
| Metric | Nitrate-N Load (million lb/yr) | Total Phosphorus Load (million lb/yr) | Water Yield (in/yr) |
|---|---|---|---|
| 1980–96 Baseline Average Value | 397 | 34 | 13 |
| 2013–17 Average Value | 425 | 42 | 14.7 |
| 2013–17 % Change from Baseline | 7% | 23% | 13% |
| 2014–18 Average Value | 380 | 41 | 14.1 |
| 2014–18 % Change from Baseline | -4.40% | 20% | 9% |
| 2015–2019 Average Value | 448 | 46 | 16.3 |
| 2015–2019 % Change from Baseline | 13% | 35% | 25% |
| 2016–20 Average Value | 461 | 48 | 16.8 |
| 2016–20 % Change from Baseline | 16.20% | 42% | 30% |
| 2017–21 Average Value | 416 | 46 | 15.9 |
| 2017–21 % Change from Baseline | 4.80% | 35% | 23% |
| 2018–22 Average Value | 385 | 46 | 15.8 |
| 2018–22 % Change from Baseline | -3% | 35% | 22% |
| 2019–23 Average Value | 381 | 44 | 15.3 |
| 2019–23 % Change from Baseline | -4.0% | 29% | 18% |
| 2020–24 Average Value | 332 | 38 | 13.2 |
| 2020–24 % Change from Baseline | -17% | 12% | 2% |
Major River Loads and Water Yield
The major rivers monitored by USGS super gages include:
- Big Muddy
- Embarrass
- Green
- Illinois
- Kaskaskia
- Little Wabash
- Rock
- Vermilion
Five-year average nitrate-nitrogen loads in Illinois major rivers vary in magnitude. Loads also vary over time within watersheds.
WQ.07: Nitrate-Nitrogen Loads In Eight Major Rivers Draining Illinois During The 1980-96 Baseline Period And Recent 5-Year Periods
WQ.08: Changes In Nitrate-Nitrogen Loads In Eight Major Rivers Draining Illinois From Recent Five-Year Periods Compared To The 1980-96 Baseline Period
Five-year average total phosphorus loads in Illinois major rivers vary in magnitude. Loads also vary over time within watersheds.
WQ.09: Total Phosphorus Loads In Eight Major Rivers Draining Illinois During The 1980–96 Baseline Period And Recent Five-Year Periods
WQ.10: Changes In Total Phosphorus Loads In Eight Major Rivers Draining Illinois From Recent Five-Year Periods Compared To The 1980-96 Baseline Period
Water yields in Illinois major rivers vary in magnitude. Water yields also very within watersheds over time.
WQ.11: Percent Changes In River Flow, Or Water Yield, From The 1980–96 Baseline Period To Five Recent Five-Year Periods In Eight Major Rivers Draining The State
Although higher runoff contributes to rising nutrient loads, the data show that nutrient loads among watersheds and within watersheds compared to the 1980-96 baseline are not uniform. This suggests that other factors, such as drainage area, nutrient management practices, land use, legacy nutrients in soils, aquifers, and streams, hydrology, and other factors also contribute to nutrient load differences seen across watersheds.
Statewide Nutrient Yields
Yield analyses allow watersheds of different sizes to be compared consistently. Nutrient yield values, measured in pounds of nutrient loss per acre per year, vary widely among Illinois’ major river watersheds and vary over time within a watershed.
Nitrate-Nitrogen Yields
2020-24 five-year average nitrate-nitrogen yields in Illinois’ major river watersheds ranged from 2.2 to 16.0 pounds per acre per year.
WQ.12: Nitrate-Nitrogen Yield (pounds per acre per year) by Major River Super Gage Station (1980-2024)
| River System | Monitoring Locations | 1980-96 | 2013-17 | 2014-18 | 2015-19 | 2016-20 | 2017-21 | 2018-22 | 2019-23 | 2020-24 |
|---|---|---|---|---|---|---|---|---|---|---|
| Big Muddy | Murphysboro | 1.5 | 1.3 | 1.2 | 1.5 | 1.8 | 2 | 2.18 | 2.38 | 2.21 |
| Embarras | Ste. Marie | 15.3 | 19.5 | 17.6 | 19 | 18.6 | 16.5 | 13 | 11.3 | 9.69 |
| Green | Geneseo | 12.2 | 14 | 13.1 | 16.5 | 17.1 | 15.2 | 13.3 | 13.1 | 11 |
| Illinois | Valley City | 13.9 | 13.6 | 12.1 | 14.3 | 14.5 | 13.2 | 12.6 | 12.3 | 10.9 |
| Kaskaskia | Venedy Station | 3.6 | 3.1 | 2.4 | 3.2 | 3.7 | 3.4 | 3.75 | 3.64 | 3.02 |
| Little Wabash | Carmi | 3.1 | 4.3 | 3.6 | 4.1 | 3.6 | 3.7 | 3.53 | 3.34 | 2.69 |
| Rock (Illinois portion) | Joslin-Rockton | 8.6 | 17.3 | 16.6 | 20.3 | 22.1 | 18.7 | 15.1 | 13.7 | 10.6 |
| Vermilion | Danville | 24.3 | 23.3 | 20.7 | 22.2 | 20.9 | 19.6 | 18.2 | 16.4 | 16 |
Total Phosphorus Yields
2020-24 five-year average total phosphorus yields in Illinois’ major river watersheds ranged from 0.39 to 1.59 pounds per acre per year.
WQ.13: Total Phosphorus Yield (pounds per acre per year) by Major River Super Gage Station (1980-2024)
| River System | Monitoring Locations | 1980-96 | 2013-17 | 2014-18 | 2015-19 | 2016-20 | 2017-21 | 2018-22 | 2019-23 | 2020-24 |
|---|---|---|---|---|---|---|---|---|---|---|
| Big Muddy | Murphysboro | 0.69 | 0.86 | 0.87 | 1.02 | 1.06 | 1 | 1.03 | 1.03 | 0.85 |
| Embarras | Ste. Marie | 1.23 | 1.18 | 1.14 | 1.38 | 1.59 | 1.56 | 1.63 | 1.61 | 1.41 |
| Green | Geneseo | 0.97 | 0.6 | 0.59 | 0.93 | 0.98 | 0.89 | 0.81 | 0.76 | 0.39 |
| Illinois | Valley City | 0.95 | 1.19 | 1.17 | 1.24 | 1.25 | 1.17 | 1.15 | 1.1 | 0.99 |
| Kaskaskia | Venedy Station | 0.86 | 1.41 | 1.24 | 1.59 | 1.73 | 1.74 | 1.87 | 1.85 | 1.59 |
| Little Wabash | Carmi | 0.96 | 1.43 | 1.4 | 1.71 | 1.8 | 1.79 | 1.93 | 1.9 | 1.55 |
| Rock (Illinois portion) | Joslin-Rockton | 0.86 | 0.95 | 0.91 | 1.15 | 1.24 | 1.1 | 0.9 | 0.8 | 0.55 |
| Vermilion | Danville | 1.19 | 1.06 | 1.14 | 1.31 | 1.3 | 1.16 | 1.15 | 0.99 | 0.83 |
Comparing 2020-24 nutrient yields to the 1980–1996 baseline within each of Illinois’ major river watersheds shows that some watersheds experienced increases while others experienced decreases.
WQ.14: Percent Change of Nitrate-Nitrogen and Total Phosphorus Yields (2020-24) Compared to Baseline in Major Rivers
| River | Nitrate-Nitrogen | Total Phosphorus |
|---|---|---|
| Big Muddy | 48% | 23% |
| Embarras | -37% | 15% |
| Green | -10% | -60% |
| Illinois | -22% | 5% |
| Kaskaskia | -16% | 85% |
| Little Wabash | -13% | 62% |
| Rock (Illinois portion) | 24% | -36% |
| Vermilion (Wabash) | -34% | -30% |
Major River Studies
Studies in the Rock River Basin suggest that groundwater flow paths and lag times may delay by years the movement of nitrogen inputs (fertilizer, manure, atmospheric deposition, soil mineralization) from fields to the river monitoring location at Joslin. In these areas, reduced nitrogen loss from fields may not reduce nitrate in the river for several years.
Recent research in the Illinois River Basin suggests that phosphorus storage and release within the river valley corridor (channel, floodplain, lakes and wetlands) may be increasing total phosphorus loads.
Botero-Acosta et al. (2025) analyzed phosphorus trends across the Mississippi and Atchafalaya River Basin from 2000–2020. Results show that phosphorus trends vary widely among watersheds, with local watershed conditions and management practices often playing a larger role than streamflow in influencing water quality.
Margenot et al. (2025) examined how decades of phosphorus applications have built up "legacy phosphorus" in Midwestern soils and waterways. These stored phosphorus reserves can benefit crop production but may also contribute to water quality issues for many years, emphasizing the importance of long-term phosphorus management.
Kreiling et al. (USGS data release 2025) quantified streambed sediment phosphorus dynamics at 10 stream sites in the Illinois River Basin during the summer and fall of 2024 to evaluate how streambed sediments in the Illinois River Basin store and release phosphorus. Understanding these processes helps improve knowledge of phosphorus cycling and sediment's role in influencing water quality.
Botero-Acosta et al. (2025) analyzed nitrate-nitrogen trends across the Mississippi and Atchafalaya River Basin from 2000–2020. Results show that most cropland watersheds showed declining trends, with factors other than streamflow driving changes at most sites.
Findings show that nutrient trends depend on many interacting factors including precipitation, groundwater, wetlands, lakes, reservoirs, legacy nutrients, land use, population, and conservation practices. See how findings like these shape ongoing Programs and Projects.
Learn more about watershed basics and approaches to water quality management.